Why this sample
Many retail planners still forecast in large spreadsheets, copied from last year and nudged by hand. The numbers drive what gets ordered, so a bad week costs stock or sales. A forecast that planners can see, question and adjust is a typical Product-tier job: a real model, a real data pipeline and a tool people use every Monday.
This is a sample build. There is no client, and nothing here is a result from a real company.
What it does
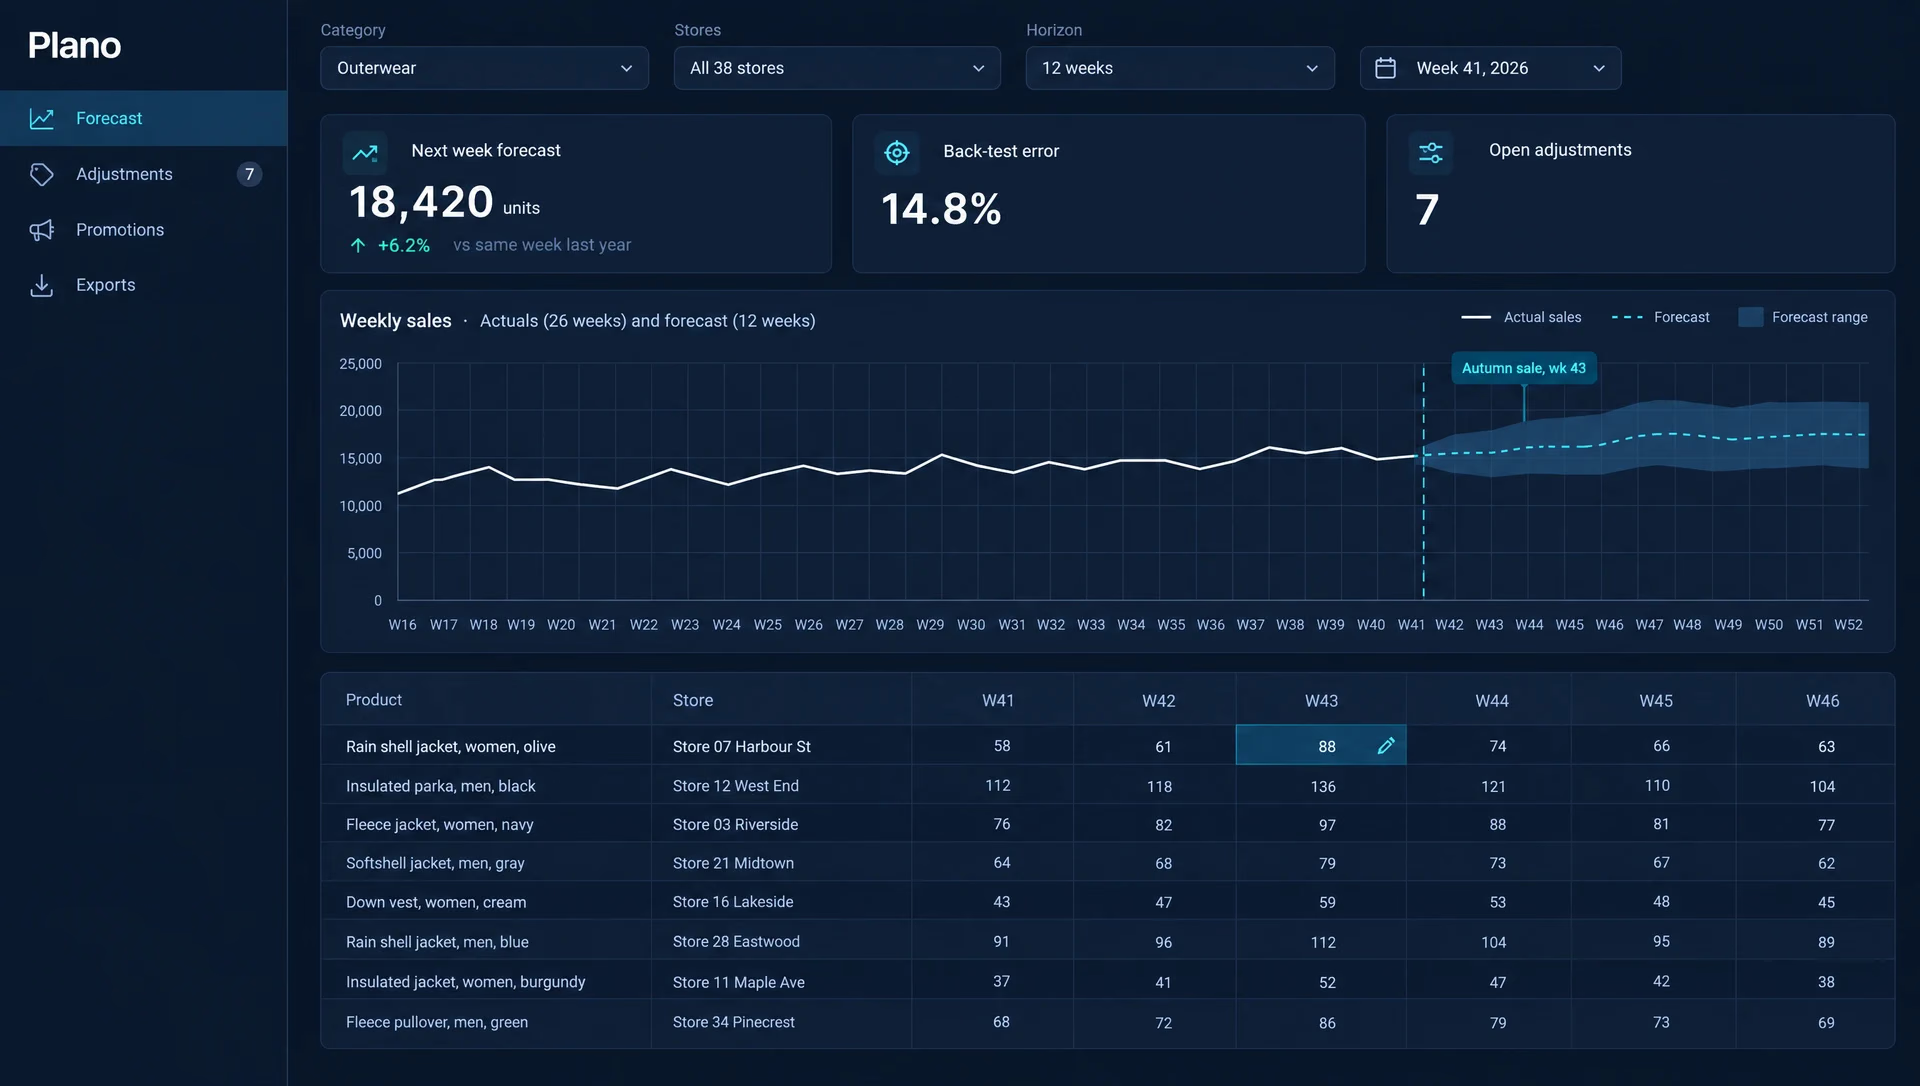
- Forecasts demand per product, store and week, twelve weeks ahead, with a range.
- Takes promotions, price changes, season and public holidays into account.
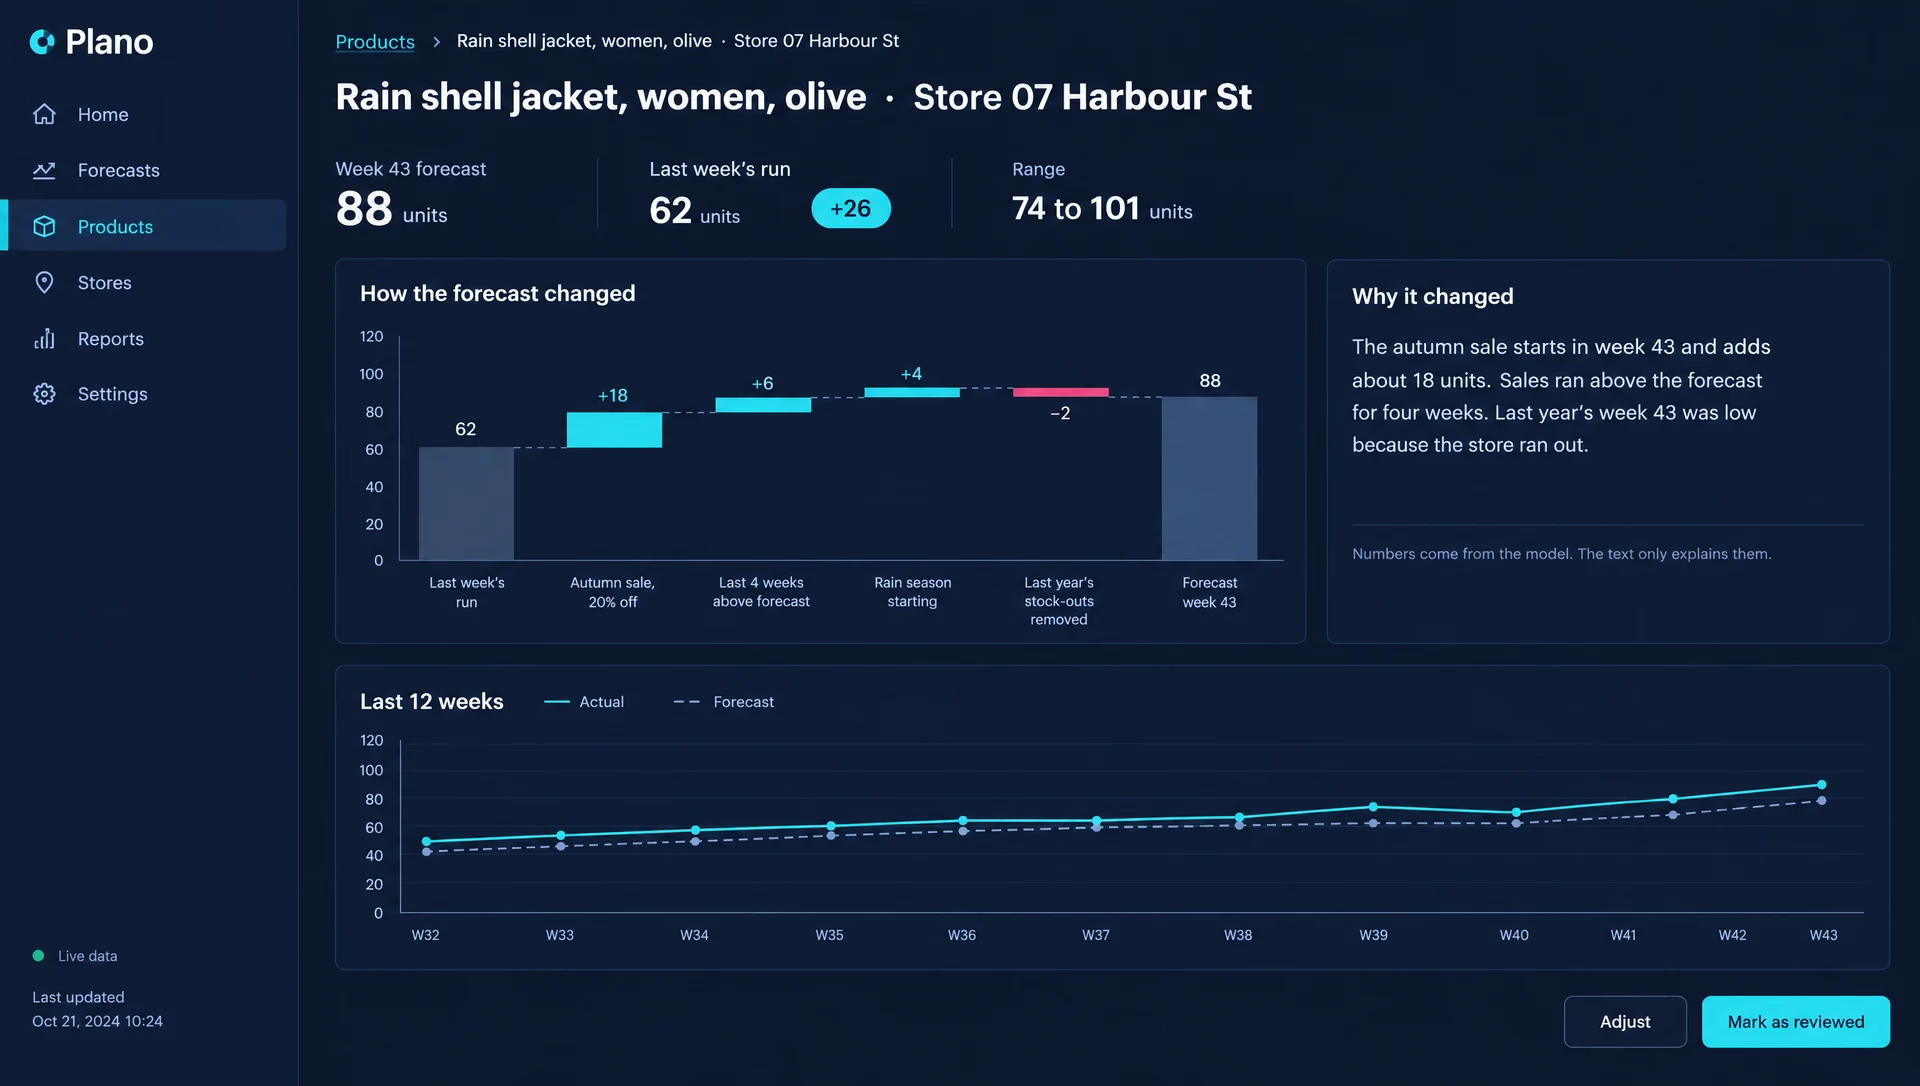
- Shows a short note for every forecast that moved a lot since last week.
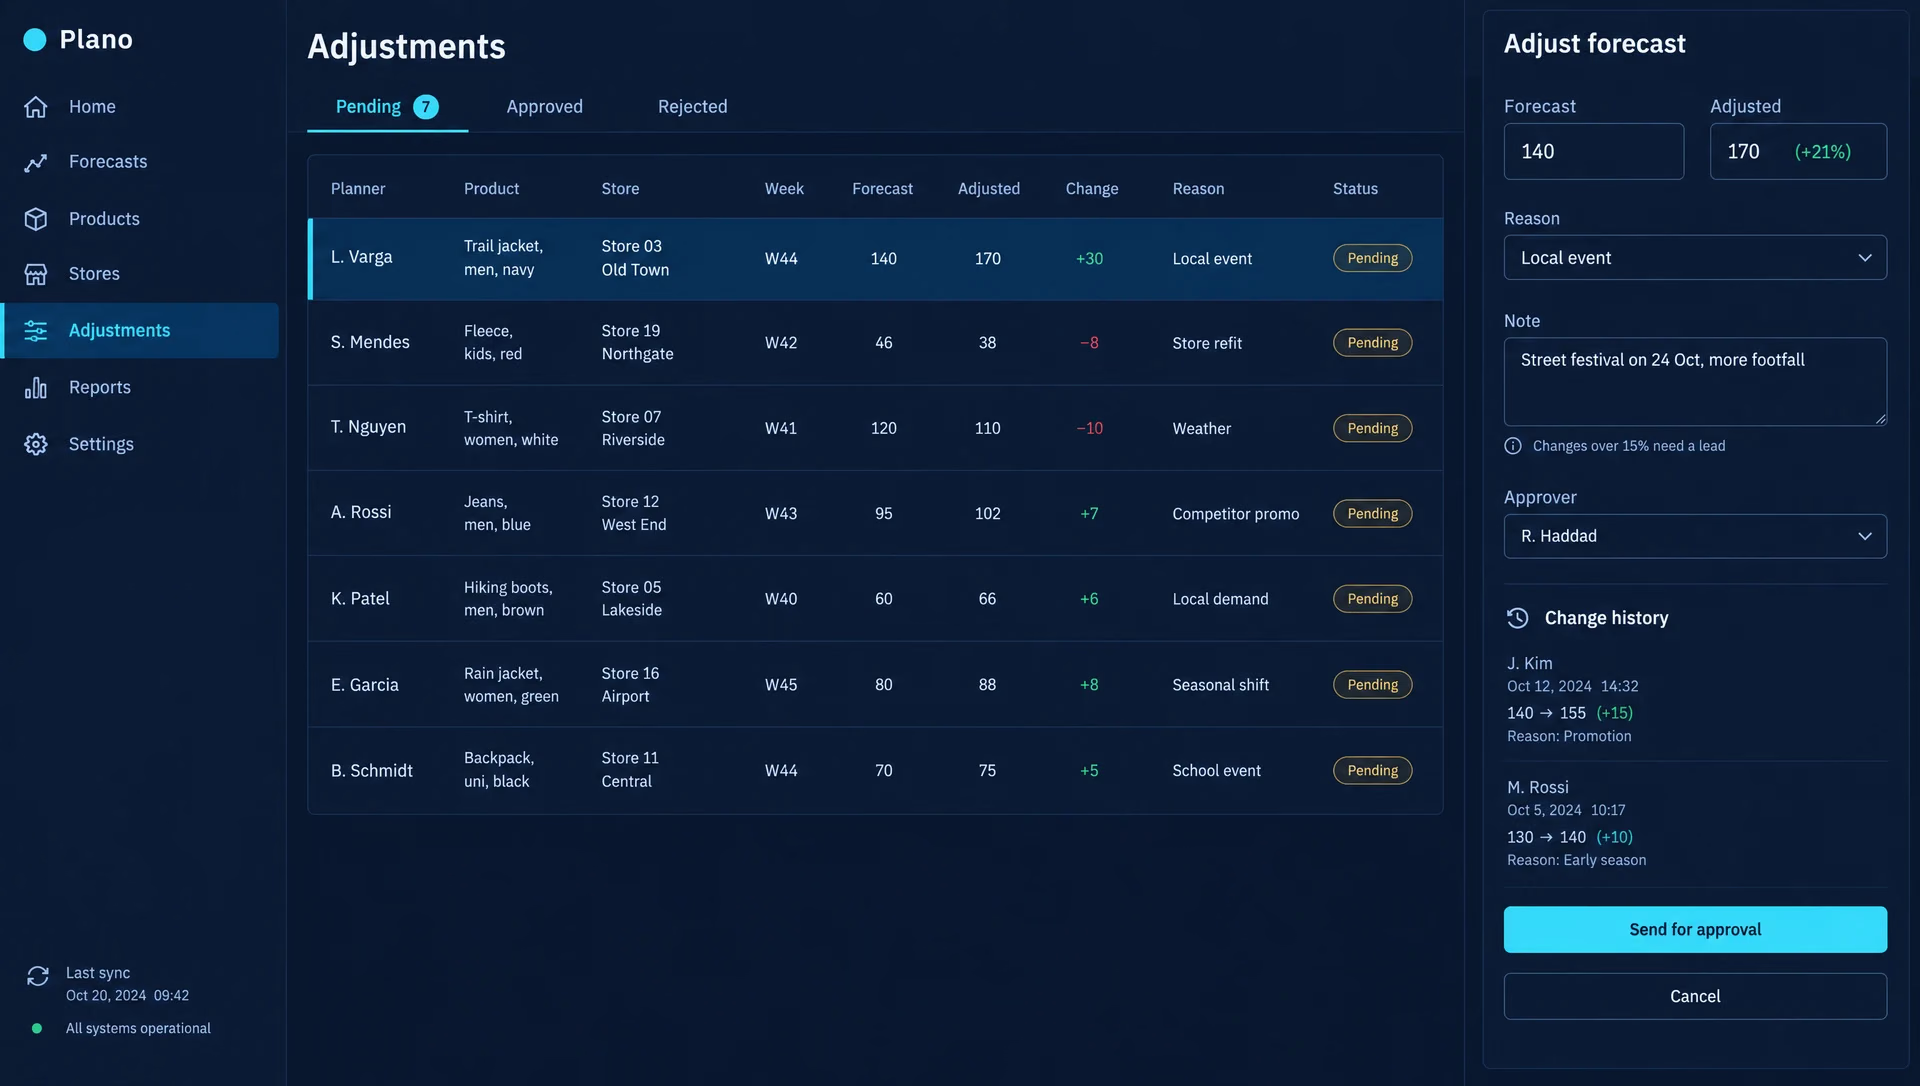
- Lets planners adjust a number with a reason, and sends big changes to a lead for approval.
- Keeps the history of every forecast and every edit.
- Exports the final numbers as a file for the ordering system.
The AI part
The forecast is a classic model trained on sales, promotions, prices and holidays, not a language model. It gives a number and a range, and we check it every week against real sales. A language model writes the short note on why a forecast moved. It works only from the model’s own input contributions, so the note can say “the autumn sale adds 18 units”, and it never changes a number.
Before launch we would back-test on the last 26 weeks of data and show the error per product group, so planners know where to trust the forecast less. Planners make the final call, and every edit keeps its reason.
Where it stops
No automatic orders to suppliers and no price setting. The output is a forecast file that the ordering system reads. Store replenishment on top of the forecast is a natural next phase.
Timeline
| When | What happened |
|---|---|
| Week 1 | Data model for products, stores and weeks; sales history import; a cleaned sample of two years. |
| Week 2 | Baseline forecast, back test on the last 26 weeks, error by product group. |
| Week 3 | Promotions, prices and holidays as model inputs, a second back test. |
| Week 4 | Forecast grid by product and store, filters, the 12-week chart with a range. |
| Week 5 | Planner adjustments with a reason, approval by a lead, history of every change. |
| Week 6 | Change notes: what moved since last week and why, written from the model's inputs. |
| Week 7 | Weekly run on a schedule, CSV export for the ordering system, alerts on big swings. |
| Week 8 | Load test on the full product list, planner walkthrough, runbook and handover. |