Why this sample
Customer teams in B2B software often learn that an account is in trouble when the cancellation email arrives. The warning signs were there, but spread over three tools: usage fell, tickets piled up, a payment failed. One score with a plain reason is a clean Feature-tier job, built on data the company already has.
This is a sample build. There is no client, and nothing here is a result from a real company.
What it does
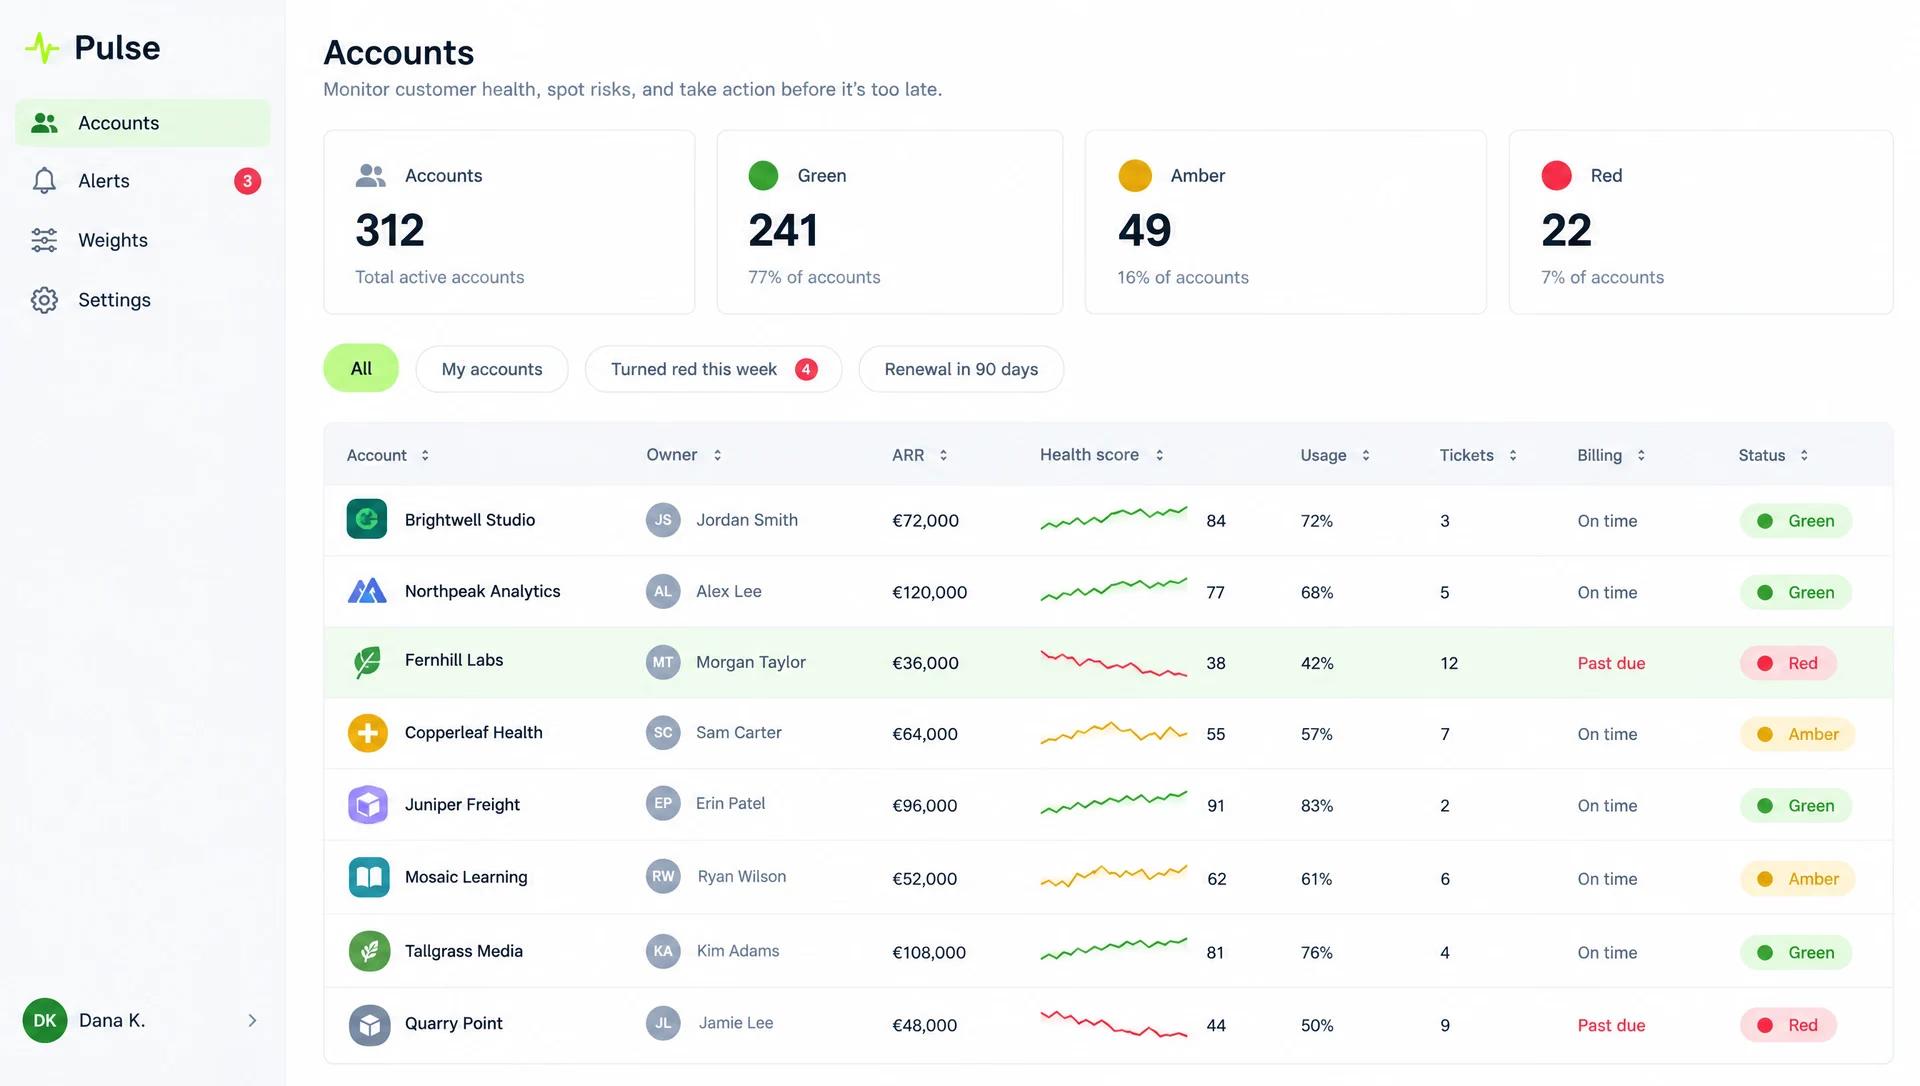
- Pulls product usage, support tickets and billing into one table per account, once a day.
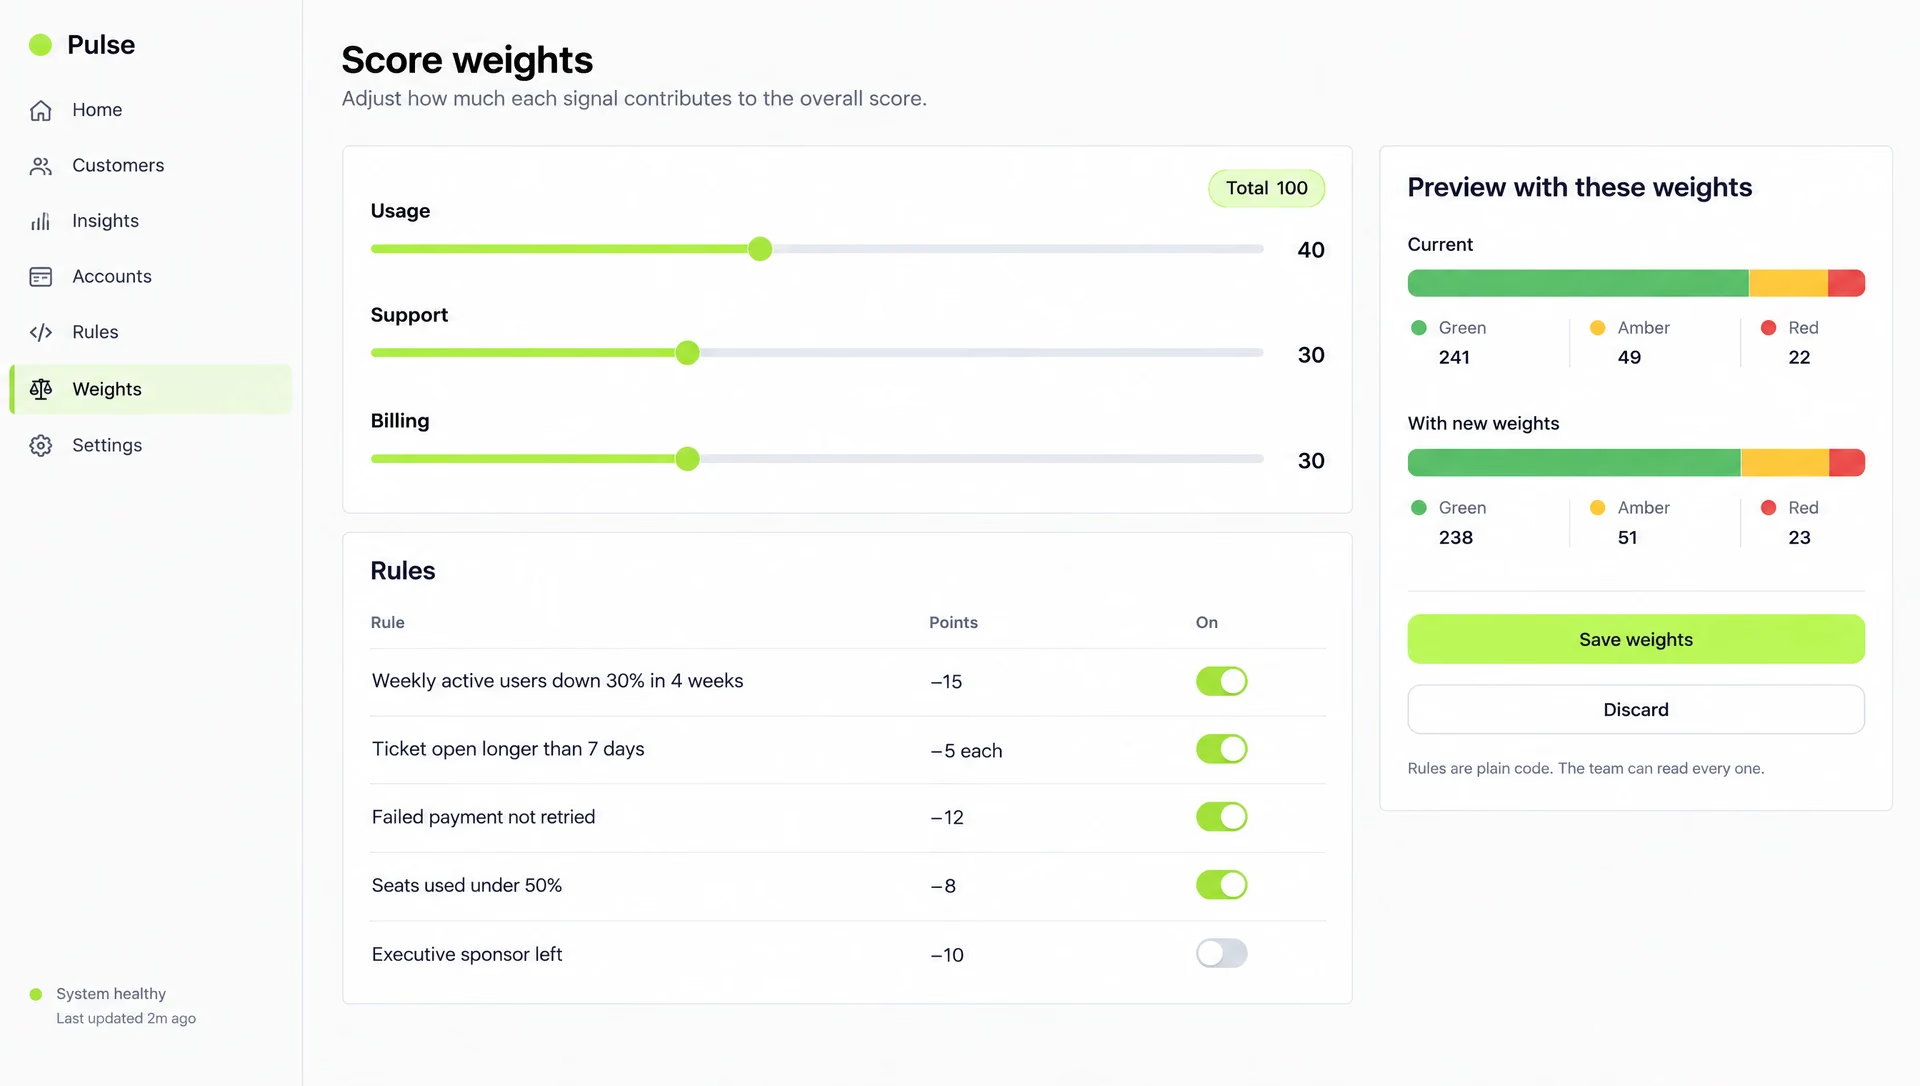
- Gives each account a score from rules and weights the team can read.
- Marks accounts green, amber or red and shows the trend over time.
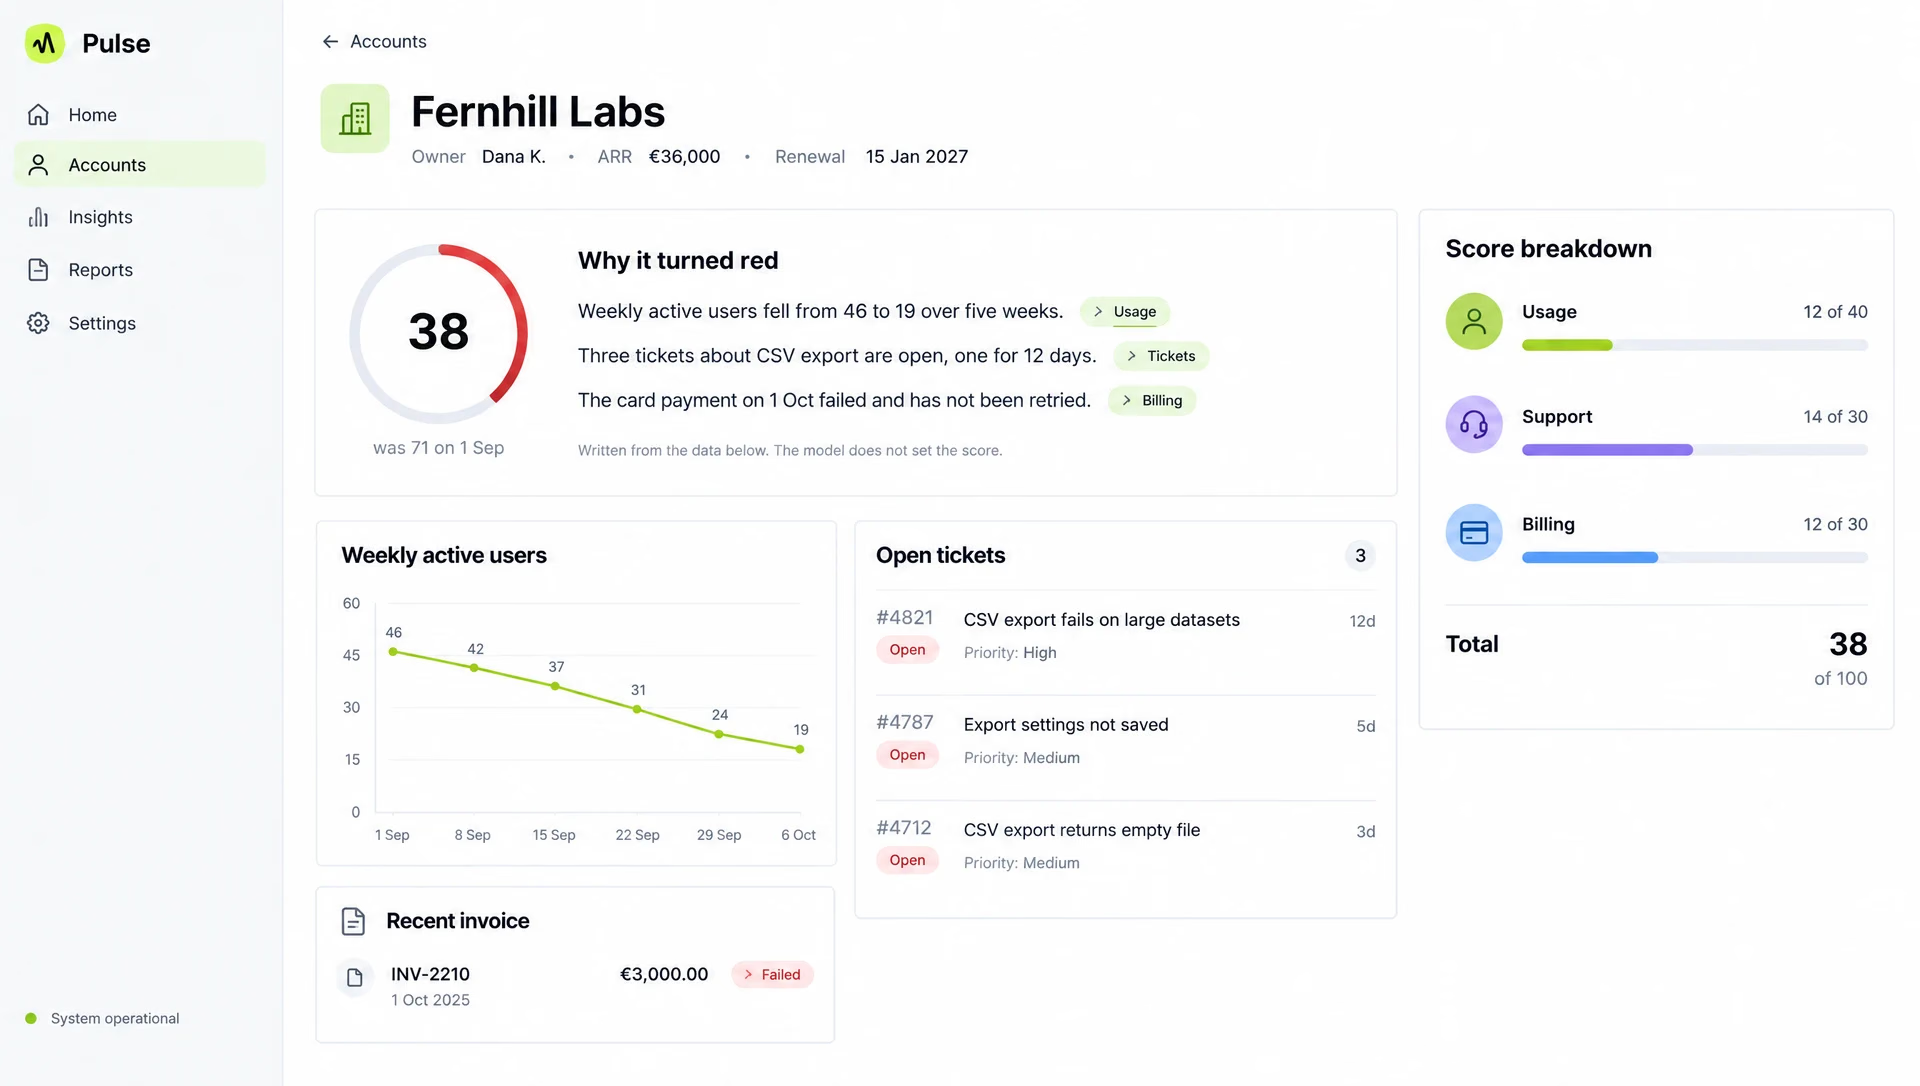
- Writes a short note when an account turns red, with a link behind every sentence.
- Alerts the account owner when one of their accounts changes colour.
The AI part
The score is plain rules and weights, not a model. The language model only writes the note on why an account turned red. It gets the signals that moved and links each sentence to its source: a usage chart, a ticket, an invoice. It never changes the score, never emails the customer and never guesses at reasons it cannot see in the data.
We would check the notes by hand on a set of red accounts: does every sentence match the data behind its link.
Where it stops
No automatic outreach to customers and no churn prediction model. A trained model needs a real history of lost accounts first, so it is a later step.
Timeline
| When | What happened |
|---|---|
| Week 1 | Read-only connections to product events, helpdesk and billing; a daily sync into one account table. |
| Week 2 | Score rules with weights, the account list with filters, score history per account. |
| Week 3 | Account page, the why-red note with links to its data, an alert to the account owner. |
| Week 4 | Hand check of notes, weight tuning with the team, runbook and handover. |